Infographics: Static or Animated?
Published by Incomedia in Guides and Tips · Thursday 11 May 2023
Searching for information online, you've no doubt come across more than one infographic. There are all kinds of them on all topics. Some are more appealing and effective, others perhaps a bit less, but they're always rather useful for immediately providing an overview of the most important information in an article.
The beauty of infographics, in fact, lies precisely in their ability to effectively synthesize and convey key data.
So let's learn more about infographics. Let's take a look at what they are, how they can be used and what advantages they have. But most importantly, let's take it a step further and see why we should consider moving from a static infographic to an animated infographic and perhaps even an interactive one.
What's an Infographic?
The term “infographic” comes from the fusion of the English words information and graphics and, as it's easy to understand, indicates a visual representation of concepts and data expressed through the use of text, images, symbols, tables and graphs, etc.
The purpose of an infographic is to summarize a considerable amount of information in a small space, taking advantage of graphic elements to highlight the most important data as well as the correlations and relationships that bind them. In this way, infographics simplify communication and this automatically facilitates the reader's understanding and learning.
Where are infographics used?
As we've already mentioned, infographics are widely used. They're used in marketing as well as for illustrating development processes and disseminating "abstract" information such as mathematical, IT or statistical processes, for example. We find them on the internet as well as in printed books and manuals, including school textbooks.
Their versatility has contributed to their success, as has the development of graphics software which makes it even easier to create them.
Do infographics make learning easier?
Compared to a simple written text, yes.
According to industry studies, people generally remember:
- 10% of what they read
- 20% of what they hear
- 30% of what they see
- 50% of what they see and hear
- 70% of what they say and write
- 90% of what they do while performing an activity
So, reading only is the least effective method! In fact, the human brain takes a long time to process letters and numbers, and after a few days, 90% of this information is forgotten. Replacing a wall of text with an infographic can therefore significantly help the reader by ensuring that they remember the information you're looking to convey for longer.
From static infographics to animated infographics
Of course, the field of infographics is quite crowded. So, how can you stand out? By taking advantage of the fact that people are inevitably attracted to anything that moves!
An animated infographic will have a much better chance of being noticed, opened and looked at. Moreover, it's a pretty simple type of animation to create. But not only that! Here are five great reasons why you should turn static infographics into animated infographics.
Compared to static infographics, animated infographics:
- Have an even greater ability to grab attention
- Further facilitate the understanding of complicated concepts
- Increase audience engagement
- Inform and, at the same time, entertain viewers
- Allow you to tell stories
Not to mention that transforming an old, static infographic into an animated one is the perfect way to give new life to content, allowing you to reuse it.
Three types of animated infographics
Animated infographics generally come in three different formats:
Animated GIF Infographics
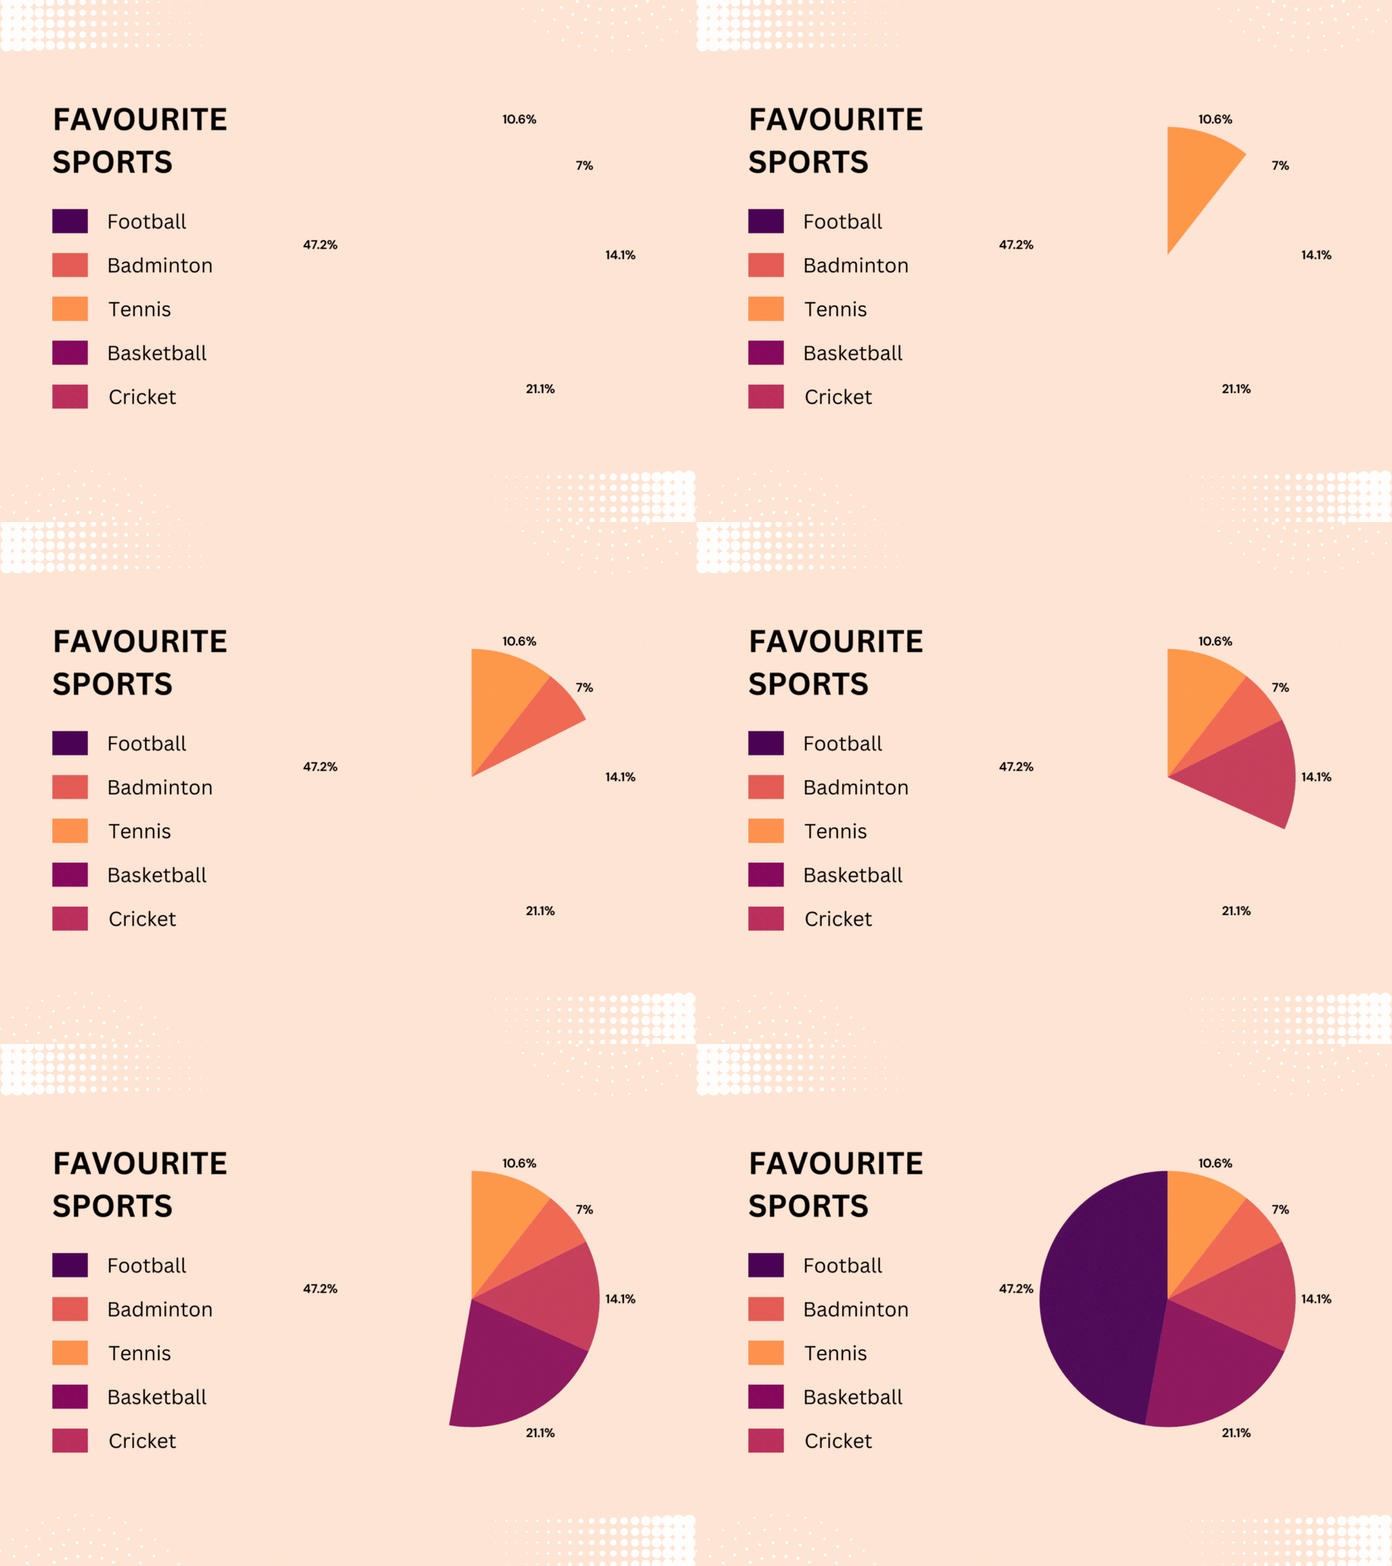
GIF animations are usually relatively simple, but no less effective. Take, for example, the animated GIF infographic below:

The infographic uses an entrance effect and a color change. These tricks are enough to capture and hold the viewer's attention. Animation helps highlight facts and figures. In this way, even a cold statistic becomes more interesting and "digestible".
Animated video infographics
One limitation of the GIF format is that it doesn't support sound. This is where animated video infographics come into play.
With this type of infographic, users can watch and hear what's being presented. A combination of visual and audio elements significantly increases comprehension and recall. An animated video infographic is, therefore, a much more effective way of conveying information.
Interactive infographics
As engaging as it can be, while watching an animated video infographic, people always maintain the role of passive spectators. They can watch and listen, but not interact.
You can always take things one step further and design interactive infographics in HTML5 which allow users to explore the content by interacting with it. In this way, everyone can choose their own pace, which results in a more personal and satisfying experience.
How to create an infographic
The good news is that, thanks to various online tools, you can produce beautiful infographics (and in some cases for free!) even if you're not particularly artistic or know how to use graphics programs.
And if you want to take a step forward and use a software tool that's just as easy to use but much more versatile in creating interactive online animations, you can't help but choose WebAnimator 4.
Conclusions
Creating an infographic is pretty easy, but it still requires a bit of effort and work. For this reason, after it's been used for the presentation it was created for, it doesn't deserve to end up locked away; it needs to be shared!
After all, infographics are one of the most viral types of content on the internet. They're shared and commented on much more easily than articles, photos or videos. We might as well use their power to our advantage.

